
 ExplainerTeleport's own work
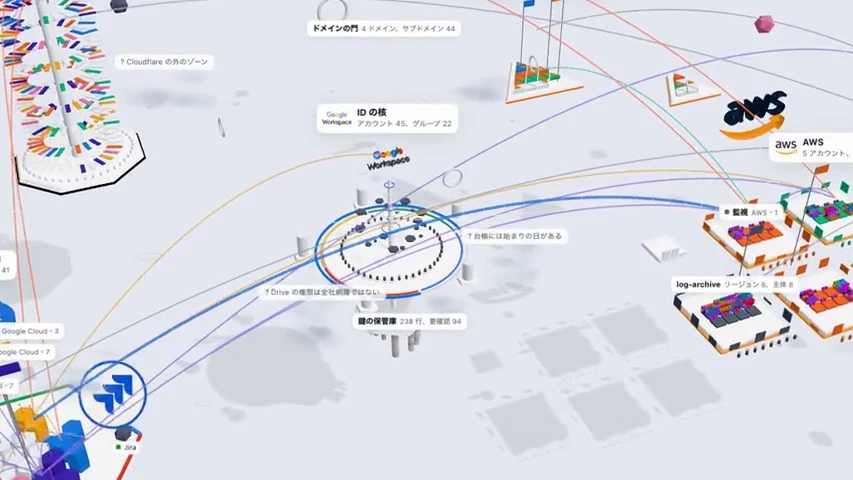
How to read CITY, in a 3-minute video: reading a company's digital infrastructure as a city
From above you see the whole; from the side, the depth of the defenses; up close, what is inside. Click a line to see connections; the fog shows what has not been investigated yet.
The higher up, the more exposed the entry point; the lower down, the data, keys and money. Lines are connections; fog marks what has not been investigated. Executives can step back for the whole picture and engineers can zoom in, on the same screen.
CITY is the system Teleport uses internally to show a company’s digital infrastructure in 3D, like a city. This video depicts its screens using a fictional company’s data and explains how to read them in about three minutes.
Start by watching the video. The narration is in Japanese; where you can’t play sound, turn on captions (CC) in the player to read it as text (Japanese captions). This article goes scene by scene, adding what to look for on screen and what to think about as you watch. Press “Watch this scene in the video” in any section to start the video above from that scene.
Why CITY was created and how Teleport used it are covered in the explainer “What is CITY?” This article is a guide to reading its screens.
01Write the company’s ledger in one fixed format, and show it as a city
Servers, accounts, domains, keys. A company’s digital infrastructure is invisible. Even written out in a table, it runs to hundreds of rows and won’t stick in your head. CITY writes it in one fixed format and shows it as a city.
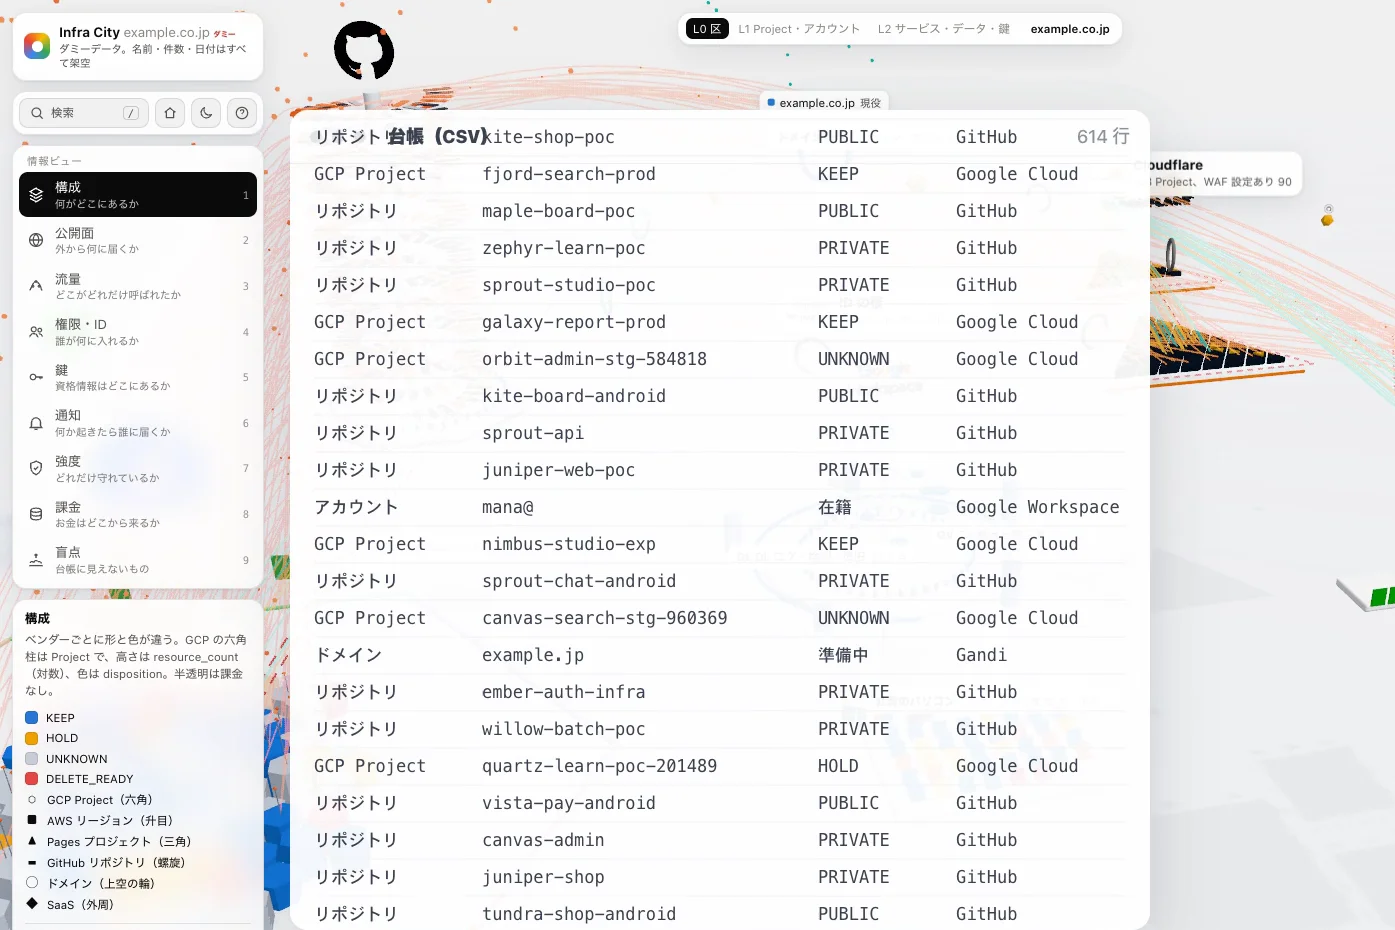
The ledger here is a table listing, row by row, everything the company uses: its type, its name, where it is and what state it’s in now. The more rows it has, the more accurate it gets, yet it soon exceeds what a person can read. At Teleport, too, even a fully organized ledger didn’t sink in for anyone, whether printed out or shown on screen.
Turn a table into a picture, and scattered rows take on position, size and lines. Without reading each one, you can see at a glance that “there’s a lot of something around here” or “only this one is off on its own.” CITY’s city is a form built for that.
02From above, the company’s assets are laid out by district
This is one company’s city, seen from above. From the center of the screen outward, the company’s assets are laid out by district. The video walks through them in this order.
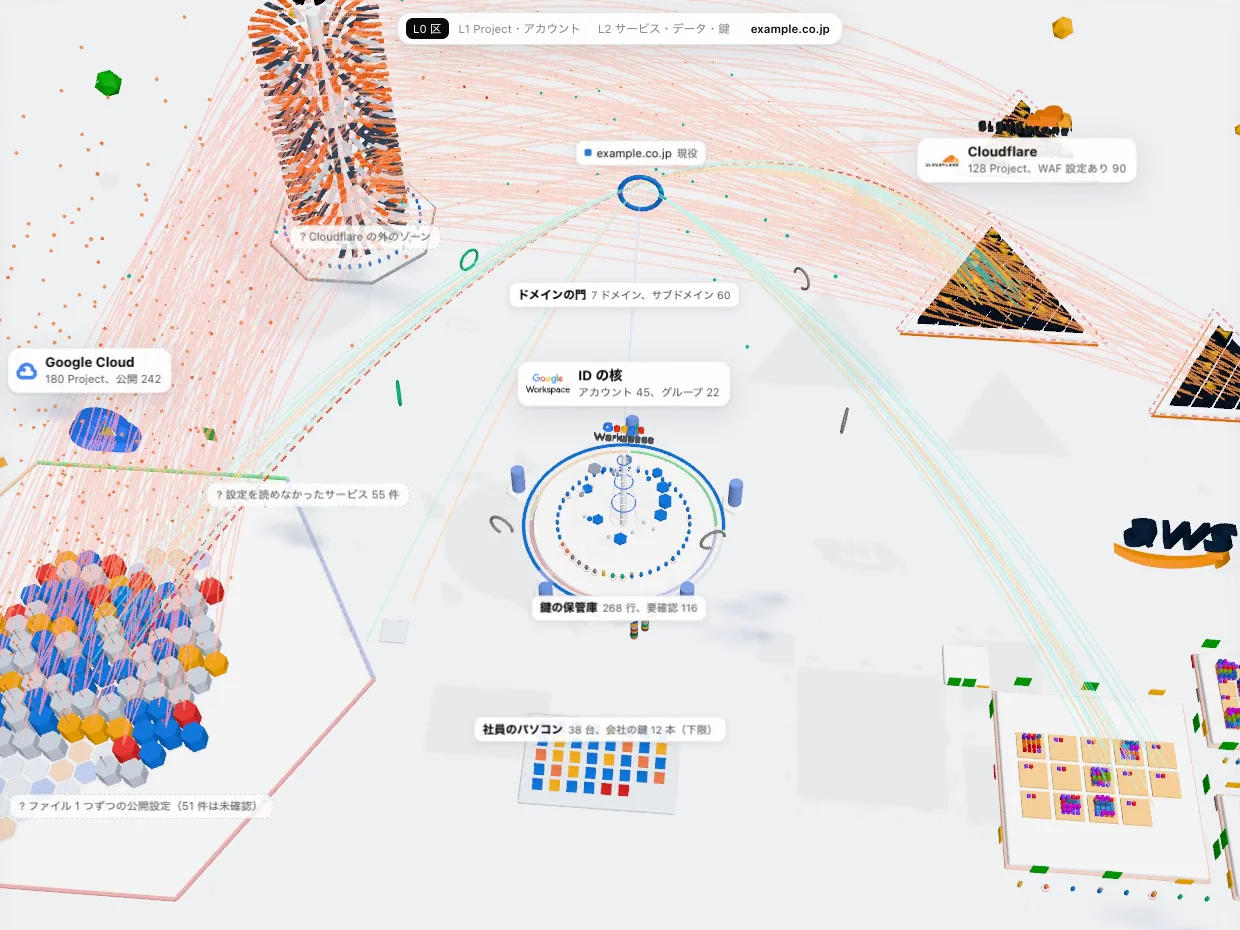
- Google Workspace: each employee’s account, and email
- Domains: the company’s addresses on the internet (names like example.co.jp)
- Where mail is sent in the company’s name: Gmail, plus services that send announcements
- Where the website is hosted
- Google Cloud and AWS: the clouds where services actually run. Inside them are file storage and databases. Customer data lives here, too
- GitHub: where the code is kept
- Work tools: Slack, Notion, Figma and other services used every day
- Employees’ computers
- Money: at the very bottom. Which cards pay, and to whom
Looking at the layout, you realize that “digital infrastructure” covers more than you thought. It isn’t just servers and the cloud. It includes employee accounts, the chat tools used every day and the cards that pay for things. If any one of them is hijacked or goes down, the company’s work stops. That’s why they all go on the same map.
03From the side, height shows how close something is to the outside
Drag to rotate the city. Seen from the side, height has meaning. The higher up, the closer to the internet: entry points visible from outside. The lower down, the further inside, where the data, keys and money are.
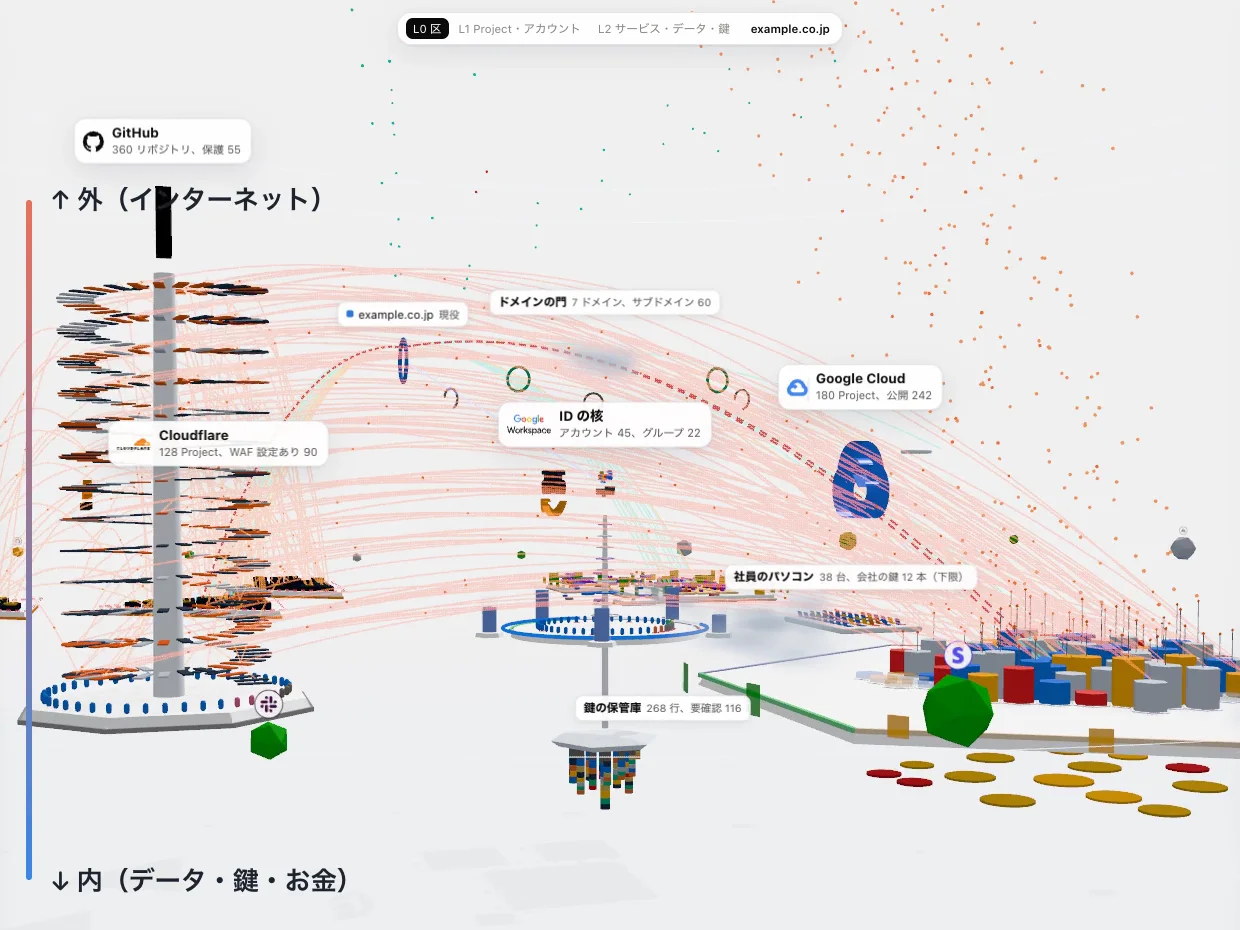
Height gives you a path for thinking about defense. Attackers come in through the entry points at the top (the website, domains, services open to the outside) and try to work their way down to the data, keys and money below. The more lines connecting top and bottom, the more ways down.
Seen from the side, if something near the top makes you ask “why is this here?”, that’s the first place to check. An entry point visible from outside stays an entry point until it’s closed, even if no one uses it.
04Zooming in adds detail, so executives and engineers can talk over the same screen
The closer you get, the more detail you see. From districts, to projects, to the services and keys inside them. Executives pull back to see the whole; engineers zoom in to see what’s inside. They can talk over the same screen.
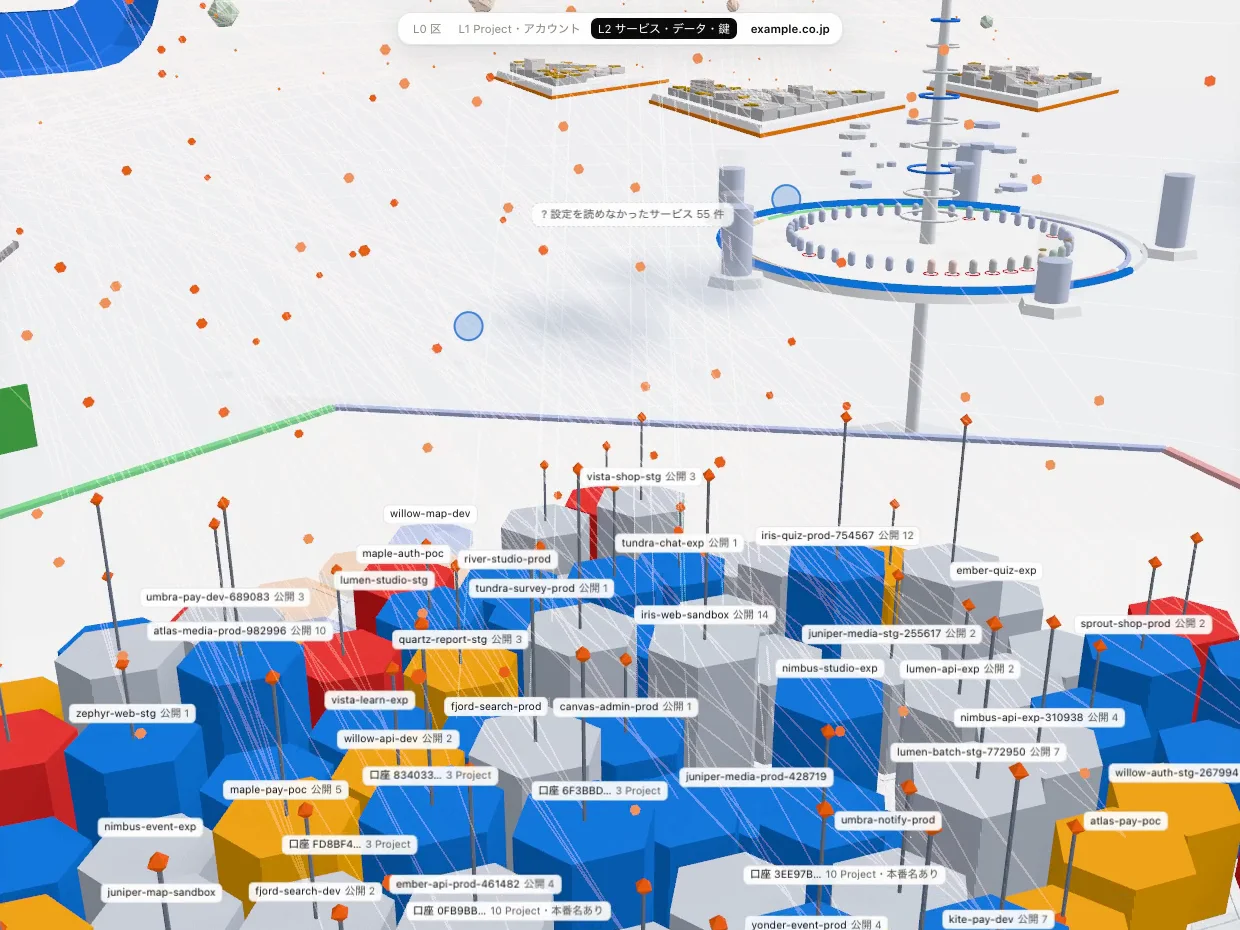
A label at the top of the screen shows which depth you’re viewing (L0 districts, L1 projects and accounts, L2 services, data and keys). On a smartphone, spread two fingers apart (pinch) to zoom in.
Being able to “pull back” and “zoom in” on the same screen is one of the most important things about CITY. An executive asks, “What’s this district?” and an engineer zooms in and answers, “This service and these keys are inside.” When people talk while looking at separate documents, they usually end up talking past each other. When they point at the same thing, they don’t.
05Click a line to see the connection and its source data
Lines are connections. Click one, and both ends appear, along with the data behind them. What depends on what. Which card is paying. Whether accounts of people who have left are still connected.
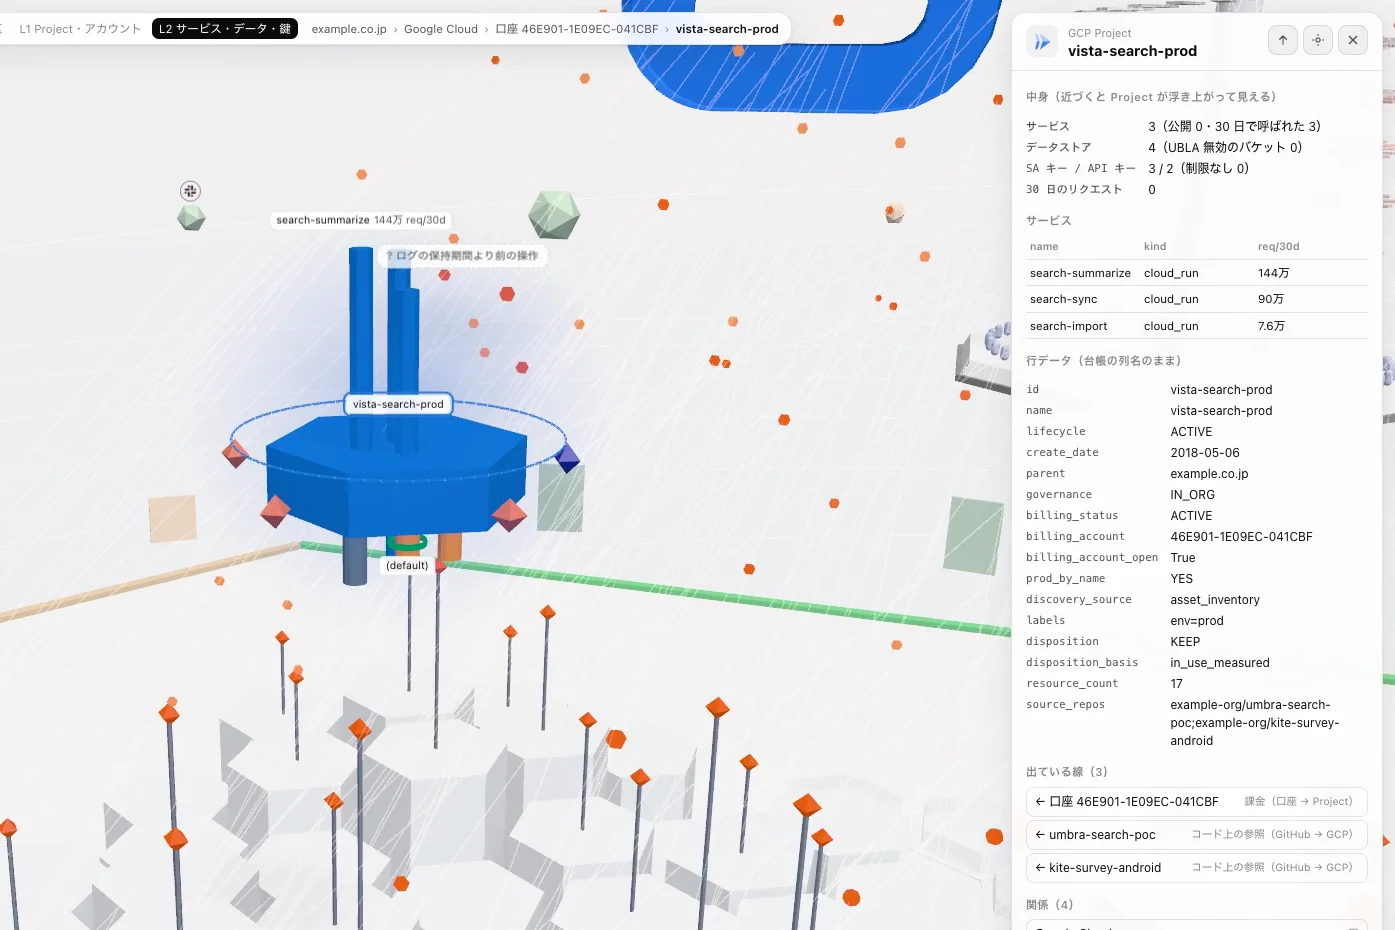
The lines on screen aren’t decoration. Each one has a row in the ledger. So when someone asks, “What’s this line?”, click it and the answer appears.
Here are three things you might want to check with the lines.
- What depends on what: when one thing stops, what else stops
- Which card is paying: whether you’re still paying with a former employee’s card, or for a contract nobody knows about
- Whether accounts of people who have left are still connected: when people leave, their accounts and permissions don’t disappear on their own
06Switch views, and a single angle stands out
Switch views, and a single angle stands out over the same city. Take notifications, for example: who an outage notice reaches, and where it gets cut off.
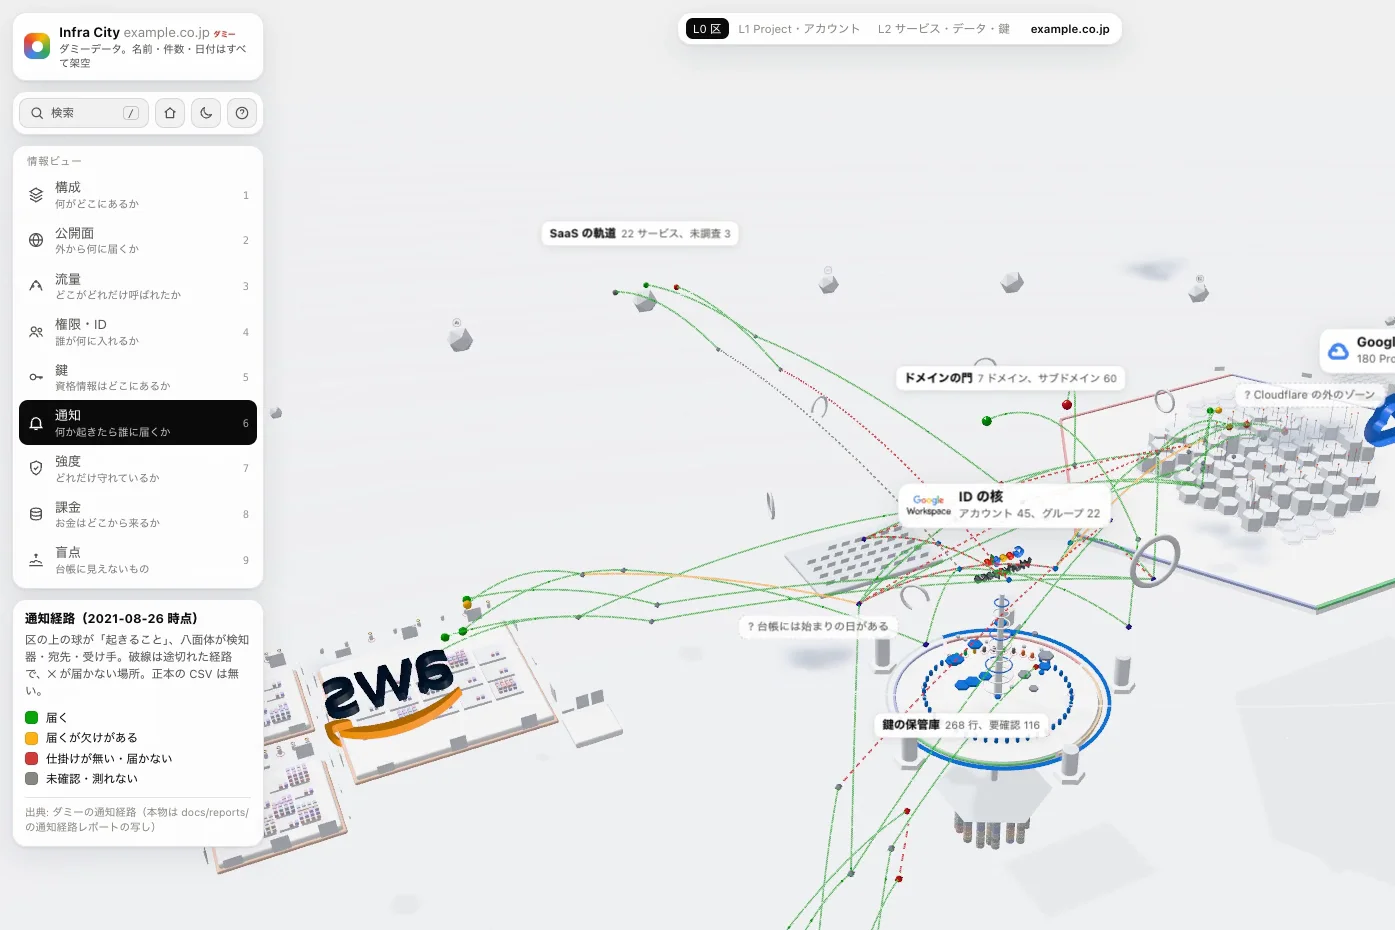
The left panel lists nine views, each with its question.
| View | Question |
|---|---|
| Structure | What is where? |
| Exposure | What can be reached from outside? |
| Traffic | What was called, and how much? |
| Permissions and IDs | Who can get into what? |
| Keys | Where are the credentials? |
| Notifications | Who hears about it when something happens? |
| Strength | How well is it protected? |
| Billing | Where does the money come from? |
| Blind spots | What the ledger doesn’t show |
Look at everything at once, and there are too many lines to read. Pose one question, and bring out just that angle.
Many people don’t usually think about notifications. But whether you notice an outage or an attack depends on whether the notice reaches the right person. Gaps such as notices going only to a former employee’s email, or to an address nobody reads, go unnoticed until the night of an incident.
07Fog marks the places not yet investigated
Where there’s fog, nobody has investigated yet. Not knowing is different from not existing. The extent of the fog is how much you haven’t grasped yet.
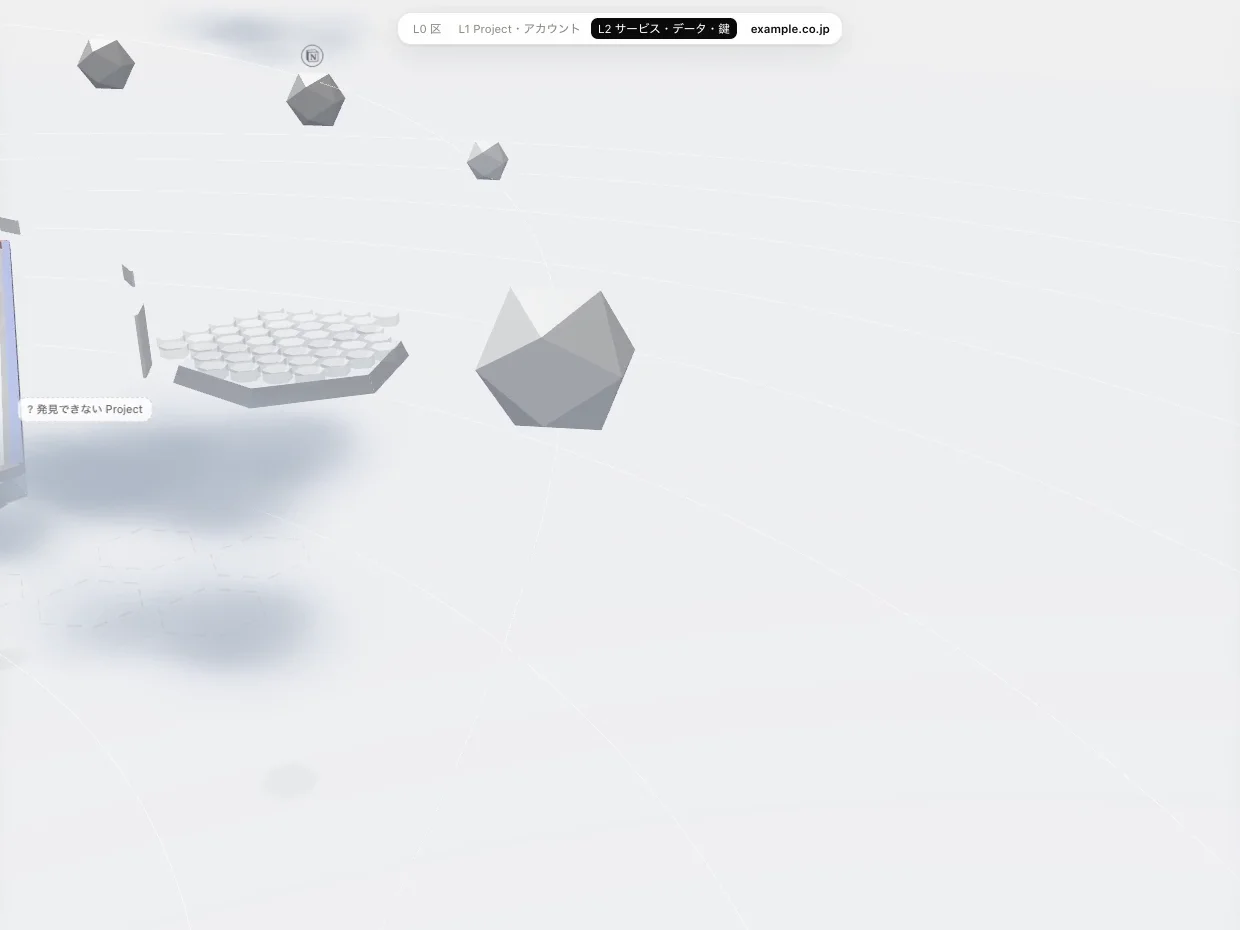
On an ordinary map, anything not written in the ledger simply “doesn’t exist.” CITY draws “doesn’t exist” and “not yet investigated” as different things. When Teleport took stock internally, about 70% was clear right away, but 30% wasn’t, and about 10% of it was a complete mystery (What is CITY?).
The fog isn’t there to hide things. It’s there to show honestly how far you understand and where the unknown begins. As the fog clears, that is exactly how much further the company’s grasp has come.
08When the ledger changes, AI agents redraw the city
When the ledger changes, AI agents redraw the city. If there’s something you don’t understand, ask in the chat, and they’ll show you on the city.
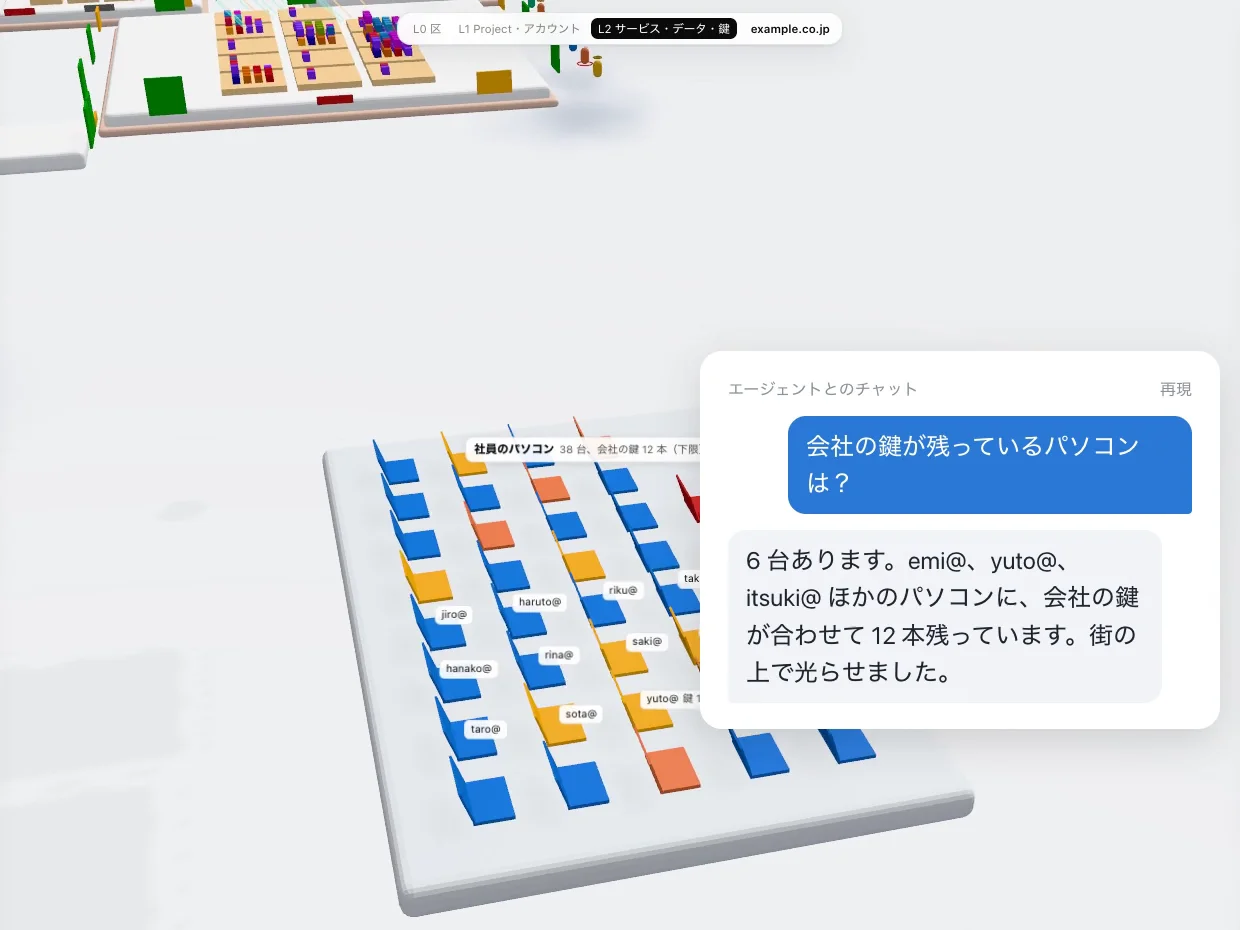
A company’s digital infrastructure changes every day. People join and leave, try out services, add contracts. Even if you draw it cleanly once, the map goes out of date fast unless you keep fixing it by hand. In CITY, AI agents take on that redrawing.
You can ask in everyday language. Ask “Which computers still have company keys on them?” and the answer comes back in text, with the matching spots lighting up on the city. At Teleport, on the night of the PHP vulnerability on October 21, 2026, too, the response began by calling an agent in the chat (What is CITY?).
09Executives and employees can look at the same city and talk it through
Executives and employees can look at the same city and talk it through.
Conversations about security tend to stall between people who know a lot and people who don’t. Those who don’t know what to ask, and those who do don’t know where to start explaining. When everyone is looking at the same city, the conversation can start with “What’s this?”
10At your own company, check three things first
Even without CITY at hand, the way of reading shown in the video can help you think about your own company. After watching the video together at work, try talking through these three things.
- What sits at the very top (the entry points visible from outside): the website, domains, services open to the outside. Is there anything you aren’t using?
- Whether anyone who has left is still at the end of a line: accounts, permissions, cards paying for things, notifications being delivered
- Where the fog is: services and contracts nobody can explain. Write down the things that aren’t “nonexistent” but “unknown,” and mark them as unknown
Even if the answers to the third are almost all “we don’t know,” that is your starting point. Teleport’s CITY also began by clearing the fog one patch at a time.
About this article
The narration of the video “How to read CITY” (about three minutes, Teleport Inc.) has been edited into written form, with notes added scene by scene by the Data is CITY Media editorial team. The screens in the video and the article are examples drawn with a fictional company’s data for the video; the names and numbers are not real. The video’s narration is an AI-generated voice, in Japanese.
The ledger proportions (70%, 30%, 10%) and the response on the night of the PHP vulnerability are based on Teleport’s internal records and have not been verified by a third party.